Contents
- 1 Introduction: Leveling Up in the World of Trading
- 2 Section 1: What Trading Is Like
- 3 Section 2: The Trading Journey
- 4 Section 3: Your Trading Tools
- 5 Indicators and Charts: Your GPS
- 6
- 7 Section 4: The Traffic Light Trading System
- 8 Section 5: Risk Management 101
- 9 Conclusion: Your Trading Superhero Journey Awaits
- 10 FAQs
Introduction: Leveling Up in the World of Trading
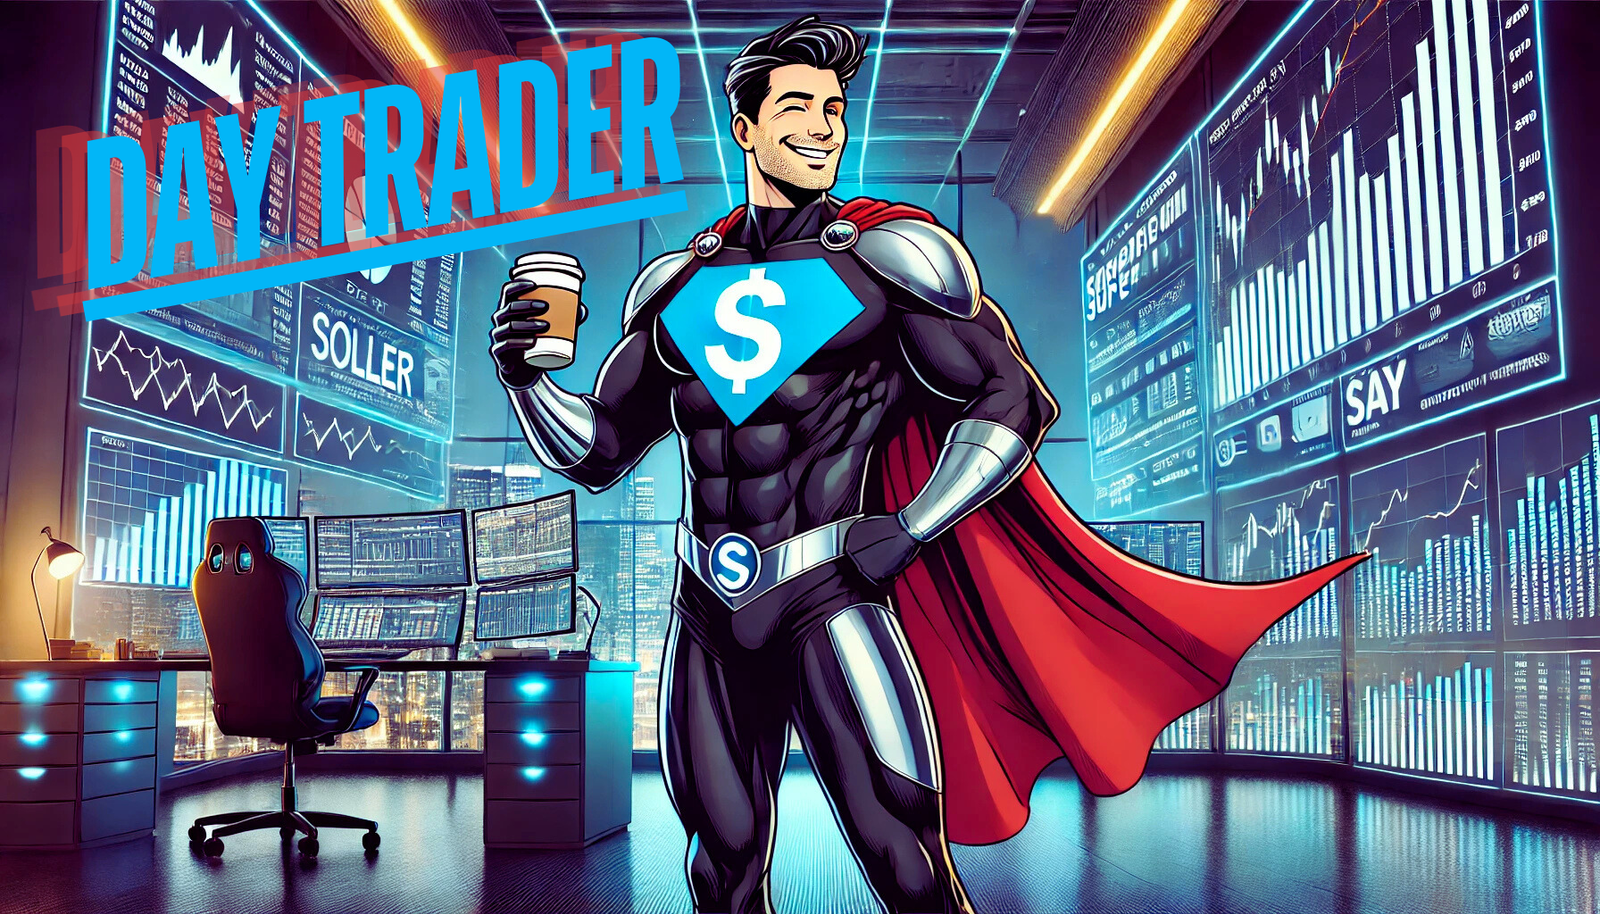
Alright, picture this: You’re sitting in your gaming chair, monitors glowing, coffee in hand, and you’re ready to conquer the markets like a boss. Trading isn’t just for Wall Street suits or math geniuses—it’s a skill, and like any skill, it can be learned. Whether you’re starting from scratch or have dabbled in the past, this guide is here to turn you into a market-slaying, profit-grabbing superhero.
Here’s the deal: Trading is like a mix of playing your favorite video game, solving puzzles, and making strategic moves—all while watching your money grow. Sounds exciting, right? But let’s keep it real: It’s not all rainbows and rocket ships. There’s a learning curve, a few stumbles, and moments where you’ll feel like throwing your keyboard out the window. That’s where this guide comes in.
We’re not here to drown you in boring jargon or overwhelm you with complicated charts. Instead, we’ll break it down into bite-sized, actionable steps that make sense. Think of it like unlocking levels in a game—starting simple, mastering each skill, and moving up to tackle the big bosses of the trading world. By the end, you’ll know how to:
- Spot trading opportunities like a pro.
- Manage risk so you’re not betting the farm.
- Stay cool under pressure (like a trading ninja).
- Build a setup that makes you feel unstoppable.
So buckle up, because this isn’t your average trading tutorial. This is your ultimate cheat code to leveling up in the markets. Whether you want to make a little side cash, build a full-on trading empire, or just learn a badass skill, you’re in the right place.
Ready to start your trading adventure? Let’s hit Level 1 and begin your journey to becoming a market superhero!
Section 1: What Trading Is Like
Trading is a lot like diving into a video game with levels, challenges, and endless opportunities to score big. Imagine you’re collecting coins in a game. Sometimes those coins are easy to grab—prices are moving up, the market’s hot, and you’re riding the wave. Other times, the game throws traps and obstacles your way—prices dip, emotions run high, and you’re left figuring out your next move.
Here’s what makes trading feel like a game:
- The Thrill of the Chase: Just like chasing high scores, you’re on the lookout for trades that can maximize your wins. Timing is everything, and spotting patterns becomes your superpower.
- Risk vs. Reward: Think of it as balancing a seesaw. On one side, you have potential profits; on the other, the risk of losses. Your job? Keep that balance in check.
- Skill and Strategy: Like mastering combos in a fighting game, trading is about learning the rules, practicing moves, and sharpening your instincts.
But trading isn’t just about the action—it’s also about mindset. Staying cool, keeping your emotions in check, and sticking to your plan are what separate the rookies from the pros.
Pro Tip: Don’t jump in expecting to win every trade. Losses are part of the game, and even the best players don’t hit every shot. The key is learning from those losses and coming back stronger.
In this guide, we’ll walk you through the tools, strategies, and rules to help you navigate the market like a seasoned gamer. So grab your controller (or in this case, your mouse) and get ready to rack up those trading wins!
Section 2: The Trading Journey
Trading isn’t just about jumping in and hitting buttons. It’s a progression—a journey where each level brings new skills and challenges. Let’s break it down into three stages to show you how to evolve into a trading superhero:
Level 1: The Rookie Stage
This is where every trader starts, and it’s all about learning the ropes. Think of it like the tutorial level of a game—you’re figuring out the controls and testing out your moves.
- Key Focus: Education and Practice.
- Tasks:
- Learn the basics of how the stock market works.
- Understand terms like ‘buy,’ ‘sell,’ and ‘stop-loss.’
- Watch tutorials and explore demo accounts.
- Challenges:
- Overcoming information overload.
- Resisting the temptation to jump in too soon.
Pro Tip: Start small and stay curious. Think of every trade as a mini lesson, not just a win or loss.
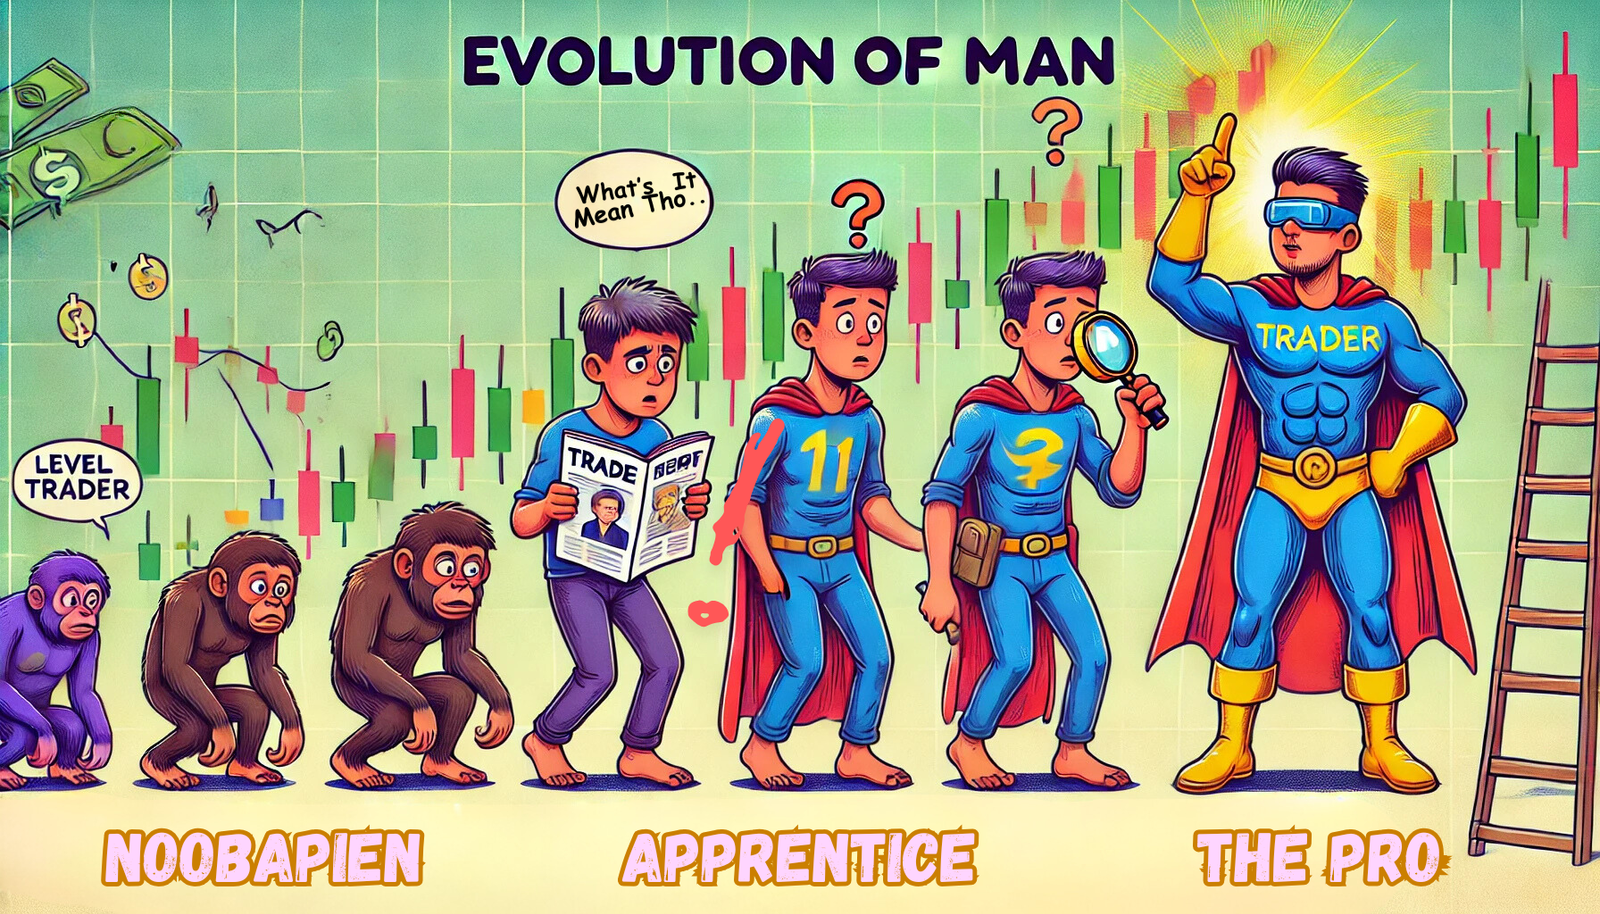
 Level 2: The Apprentice Stage
Now you’re leveling up! You’ve learned the basics, and you’re ready to apply them in real-time. This stage is about building consistency and finding your rhythm.
- Key Focus: Pattern Recognition and Strategy.
- Tasks:
- Dive into charts and learn to spot trends.
- Test simple strategies like ‘buy the dip’ or ‘follow the trend.’
- Start trading small amounts of real money.
- Challenges:
- Managing emotions when trades don’t go as planned.
- Avoiding overtrading or ‘revenge trading.’
Pro Tip: Keep a journal of your trades. Write down why you entered, how it went, and what you’d do differently next time. This is your trading diary—a tool for epic growth.
Level 3: The Pro Stage
Welcome to the big leagues. At this level, you’ve mastered the basics and intermediate strategies, and now it’s about scaling your wins and minimizing your losses like a true boss.
- Key Focus: Advanced Strategies and Emotional Mastery.
- Tasks:
- Explore advanced tools like options and futures trading.
- Scale up your trading amounts as your confidence grows.
- Stay disciplined and stick to your plan.
- Challenges:
- Battling overconfidence and greed.
- Avoiding burnout by maintaining balance.
Pro Tip: Even pros lose sometimes. The difference? They know when to cut their losses and move on. Always have an exit plan.
Every great trader has walked this journey—starting small, learning from mistakes, and building their way up. So don’t rush it. Embrace the grind and enjoy leveling up your skills one trade at a time!
Section 3: Your Trading Tools
Every superhero needs their gear, and in the trading world, your tools are what keep you sharp and ready for battle. The right setup not only gives you the edge but also helps you stay organized and focused when it matters most.
Your Command Center: The Computer
Your computer is your trading HQ. It doesn’t have to be a supercomputer, but it does need to be reliable and fast. Look for something with:
- A fast processor to handle multiple programs.
- Plenty of RAM (at least 8GB, but 16GB is even better).
- A solid-state drive (SSD) for quick loading times.
Pro Tip: If you’re serious about trading, invest in a desktop setup. Laptops work, but a desktop offers more power and expandability.
Extra Eyes: Monitors
Having multiple monitors is like having extra eyes on the market. You can keep an eye on charts, news, and trading platforms all at once without switching between tabs.
- Start with two monitors and expand if needed.
- Use one screen for charts and another for your trading platform.
Pro Tip: Position your monitors ergonomically to avoid neck strain. Your future self will thank you.
The Radar System: Trading Platforms
Your trading platform is where the magic happens. This is your radar system, showing you price movements, news updates, and market trends in real-time. Popular options include:
- Thinkorswim: Great for advanced charting and analysis.
- TradingView: A favorite for its sleek, customizable charts.
- MetaTrader 4/5: Perfect for forex and CFD traders.
Affiliate Opportunity: Link to recommended platforms with affiliate codes to earn commissions.
Indicators and Charts: Your GPS
Indicators are like your trusty co-pilot, helping you navigate the twists and turns of the market. They analyze price movements, volume, and other key data, giving you a crystal-clear picture of what’s really going on. Let’s break down the MVPs (Most Valuable Players) of the trading world—the indicators and charts you need to know.
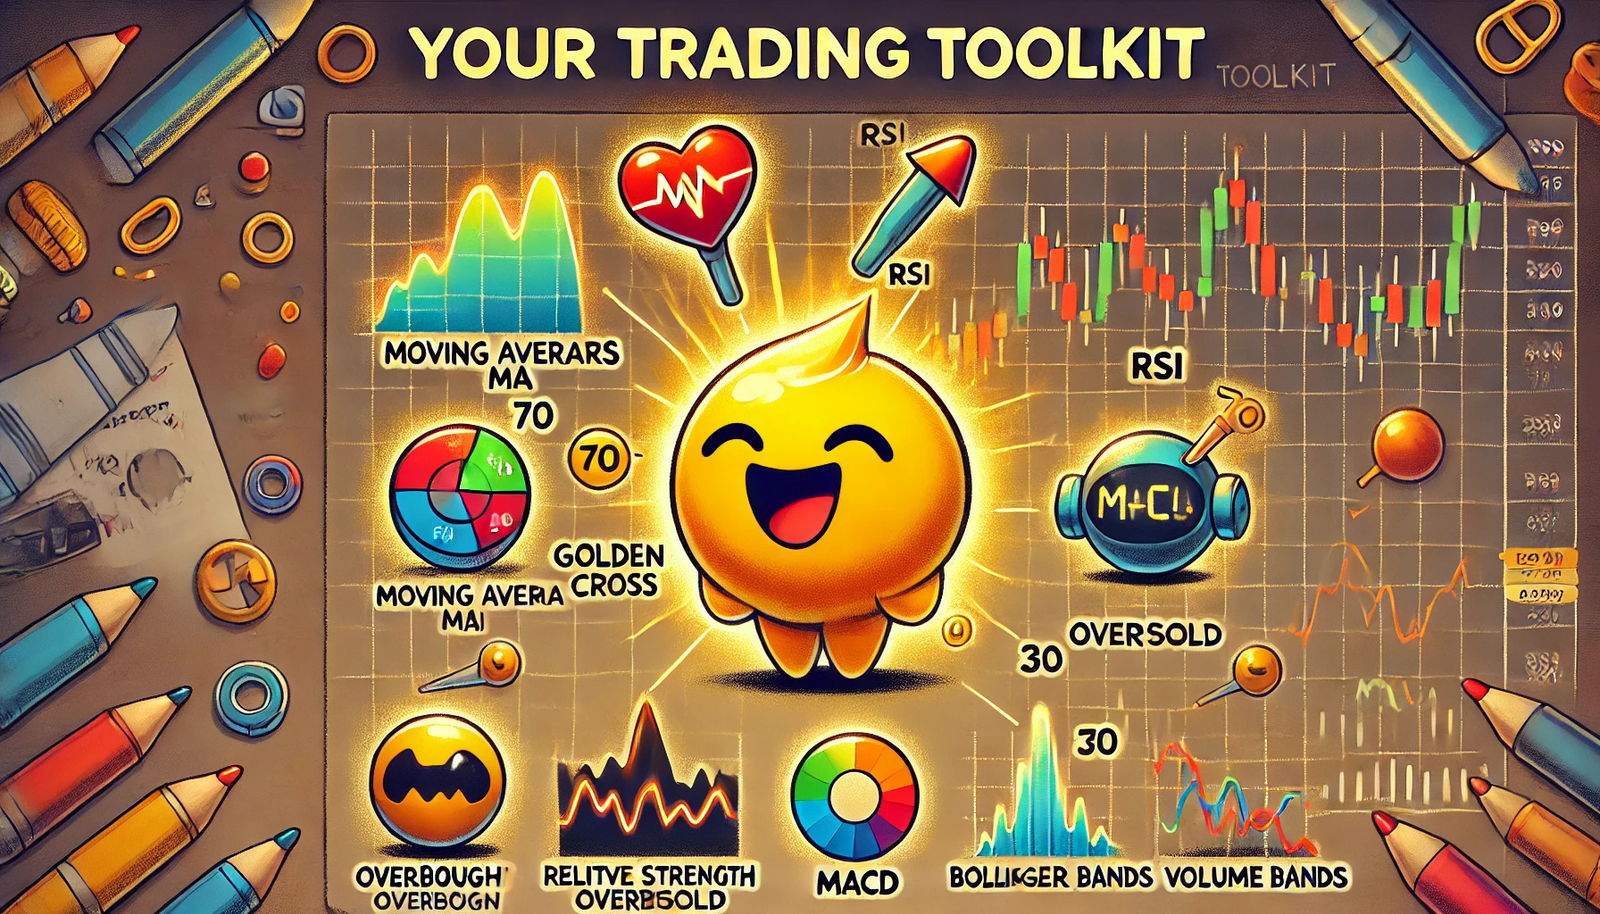
Key Indicators: Your Trading Toolkit
These tools are like power-ups for your trading strategy. They help you understand the market’s mood, spot trends, and decide when to jump in (or back off).
- Moving Averages (MA):
- What It Is: Smooths out price data to reveal trends over a specific time.
- Use Case: Helps you spot whether the market is trending up, down, or sideways.
- Pro Tip: Combine short-term (e.g., 20-day) and long-term (e.g., 50-day) moving averages. When they cross (aka a “golden cross” or “death cross”), it can signal a good time to buy or sell.
- Relative Strength Index (RSI):
- What It Is: Measures the strength of price movements to tell you if an asset is overbought or oversold.
- Use Case: If RSI is above 70, it’s likely overbought (hinting at a potential sell). Below 30? It’s oversold (hinting at a potential buy).
- Pro Tip: RSI is great, but it’s not a magic wand. Pair it with other indicators to confirm your moves.
- MACD (Moving Average Convergence Divergence):
- What It Is: Tracks momentum by comparing two moving averages.
- Use Case: Look for crossovers (when the MACD line crosses the signal line) to spot trend shifts.
- Pro Tip: MACD shines in trending markets but can get sketchy in choppy ones. Know your environment!
- Bollinger Bands:
- What It Is: A moving average with two lines that show volatility.
- Use Case: When the price hits the upper band, it’s probably overbought. If it’s near the lower band, it might be oversold.
- Pro Tip: Combine Bollinger Bands with trend indicators for a full picture.
- Volume Indicators:
- What It Is: Tracks the number of shares or contracts being traded.
- Use Case: Big volume spikes can signal strong moves. If a breakout happens on high volume, it’s more likely legit.
- Pro Tip: Volume is like the market’s heartbeat. If it’s weak, the trend might not have the strength to last.
Charts: Your Market Map
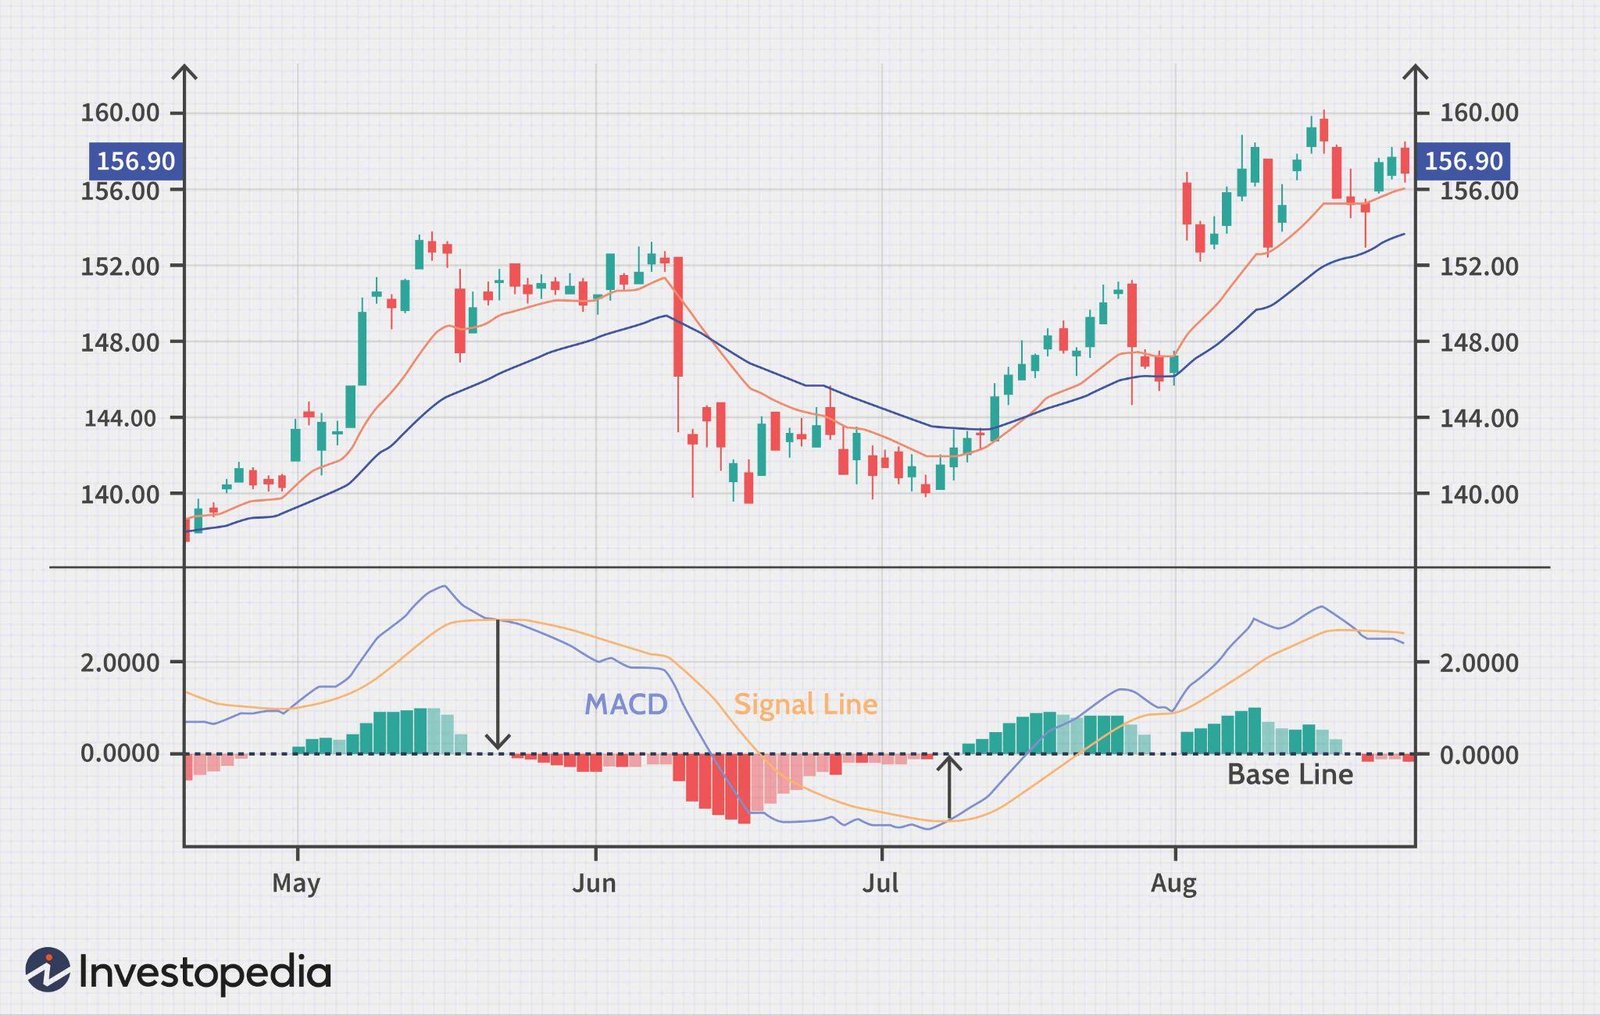 Charts turn market data into visual gold, making it easier to spot trends, reversals, and patterns. Here’s the breakdown:
- Line Charts:
- What It Is: Simple and clean, showing just the closing prices over a period.
- Best For: Beginners or when you just want a quick overview.
- Pro Tip: Perfect for spotting the big-picture trend without distractions.
- Bar Charts:
- What It Is: Displays open, high, low, and close prices for each time period.
- Best For: Traders who want more detail about price ranges without too much visual clutter.
- Pro Tip: Great for analyzing daily price ranges and spotting volatility.
- Candlestick Charts:
- What It Is: The fan favorite, candlestick charts show the same data as bar charts but in an easier-to-read, color-coded format.
- Best For: Identifying patterns and reversals at a glance.
- Pro Tip: Master patterns like Doji, Hammer, and Engulfing for a quick read on market sentiment.
How to Combine Indicators and Charts
Here’s the thing: No single indicator or chart will give you all the answers. The real magic happens when you use them together to build a killer strategy. Here’s how:
- Use moving averages to identify the overall trend.
- Confirm momentum with MACD to ensure you’re not chasing a weak setup.
- Check RSI to see if the asset is overbought or oversold before pulling the trigger.
- Add Bollinger Bands to gauge if the price is approaching extreme volatility levels.
Pro Tip: Keep it simple. Too many indicators can make your screen look like a Christmas tree and leave you overwhelmed. Stick to 2-3 complementary tools that you fully understand.
Bringing It All Together
Think of your indicators and charts as your trading squad. Each one has its own role, but together they form a team that can help you dominate the market. The key is practice. Use a demo account to test combinations until reading charts feels as natural as crushing a final boss in your favorite game.
With these tools in your arsenal, you’re not just guessing—you’re strategizing like a pro. And that, my friend, is how you trade like a superhero.
Section 4: The Traffic Light Trading System
When it comes to trading, timing is everything. That’s where the Traffic Light Trading System comes into play—a simple framework that helps you decide when to trade and when to hit the brakes.
Green Zone: Go Time (9:30 AM – 10:30 AM)
The Green Zone is when the market is buzzing with activity. This is the first hour after the stock market opens, and it’s when you’ll see the highest volume and volatility—perfect for making quick trades.
- Why It’s Green: Market activity is at its peak, giving you plenty of opportunities to find profitable trades.
- What to Do: Focus on high-volume stocks and key market movers. Be prepared to act quickly but stick to your strategy.
- Pro Tip: Use limit orders to control your entry and exit prices during this fast-paced period.
Yellow Zone: Midday Slowdown (11:00 AM – 2:00 PM)
The Yellow Zone is when the market starts to chill. Volume decreases, and price movements become less predictable. It’s still possible to trade, but you’ll need to be cautious.
- Why It’s Yellow: Lower activity means fewer opportunities and higher risks of false signals.
- What to Do: Avoid overtrading. Use this time to review your performance, research new opportunities, or simply take a break.
- Pro Tip: Consider swing trades or longer-term setups during this period if you spot a strong trend.
Red Zone: Shut It Down (After 3:00 PM)
The Red Zone is your signal to stop trading and call it a day. The market becomes more erratic as traders close their positions and prepare for the next day.
- Why It’s Red: Increased volatility combined with end-of-day rushes can lead to unpredictable price swings.
- What to Do: Focus on reviewing your trades, journaling your performance, and planning for tomorrow.
- Pro Tip: Stick to your daily profit and loss limits—don’t chase losses in the Red Zone.
Why It Works:
The Traffic Light Trading System simplifies your trading day into actionable time blocks. By aligning your trades with the market’s natural rhythm, you’ll reduce stress and improve your chances of success.
Section 5: Risk Management 101
Risk management is your ultimate shield in the trading world—it protects you from blowing up your account and keeps you in the game for the long haul. Think of it as building your defense stats in an RPG.
1. Set a Risk Limit
Decide how much of your trading account you’re willing to risk on a single trade. A common rule is 1-2% per trade. For example, if you have a $5,000 account, your max loss per trade should be $50-$100.
2. Use Stop-Loss Orders
A stop-loss order is like your safety net. It automatically closes your trade when the price hits a certain level, saving you from bigger losses.
- Place your stop-loss based on support and resistance levels.
- Adjust your stop-loss as the trade moves in your favor.
3. Diversify Your Trades
Don’t put all your eggs in one basket. Spread your investments across different stocks, industries, or markets to reduce risk.
4. Avoid Overleveraging
Leverage can amplify your wins but also magnify your losses. Use it cautiously and stick to manageable levels.
5. Stick to Your Plan
Write down your trading rules and follow them religiously. Deviating from your plan often leads to emotional trading and unnecessary losses.
Pro Tip: Always ask yourself, “What’s my exit plan?” before entering a trade.
Conclusion: Your Trading Superhero Journey Awaits
Becoming a trading superhero isn’t about overnight success or a one-time win—it’s about consistency, discipline, and leveling up your skills over time. With the right mindset, tools, and strategies, you’ll not only survive the markets but thrive in them.
Remember, every trade is a lesson. Stay curious, embrace the challenges, and never stop learning. The markets are your playground, and with this guide, you’re ready to crush it like a true pro.
So what’s next? Open that demo account, dive into the charts, and start building your trading empire. Your superhero story starts now.
FAQs
1. Do I need a lot of money to start trading?
Not at all! Many platforms let you start with as little as $100. Focus on learning the ropes before scaling up.
2. How much time do I need to dedicate to trading?
It depends on your goals. You can trade part-time or go full-time once you’ve built the skills and confidence.
3. Can I trade without prior experience?
Absolutely! Start with a demo account and free resources to build your foundation.
4. What’s the biggest mistake new traders make?
Jumping in without a plan and letting emotions dictate decisions. Stick to your strategy and manage risk carefully.
5. How do I find the best trading platform?
Research platforms based on your needs (stocks, forex, crypto) and read reviews. Popular ones include Thinkorswim, TradingView, and MetaTrader.

 Level 2: The Apprentice Stage